
I have a weakness for good scientific graphics, especially zoonotic cycles. In his recent paper, Christos Lynteris looks at these diagrams with the eye of a visual anthropologist. He explains why zoonotic cycle diagrams work, and why they sometimes confer much more information that we intend (or want). Since these diagrams are intended for public health education, designers must keep their wide audience in mind and take care with subconscious messages their work may send. They serve the dual purpose of giving experts a model to contemplate while giving the public the assurance that the CDC or other authority understands the problem. These “thinking diagrams” meet the viewer where they are, allowing many levels of interpretation.
“Zoonotic diagrams function as no less than an epidemiological Rosetta Stone, forging universally recognizable linkages between animals and humans.” Lynteris 2017, 3.
First designed to depict plague ecology, these diagrams have evolved over the last 60 years. Lynteris takes a look at two graphics provided by the CDC depicting Ebola zoonotic cycle. I found a few more graphics for further comparison.
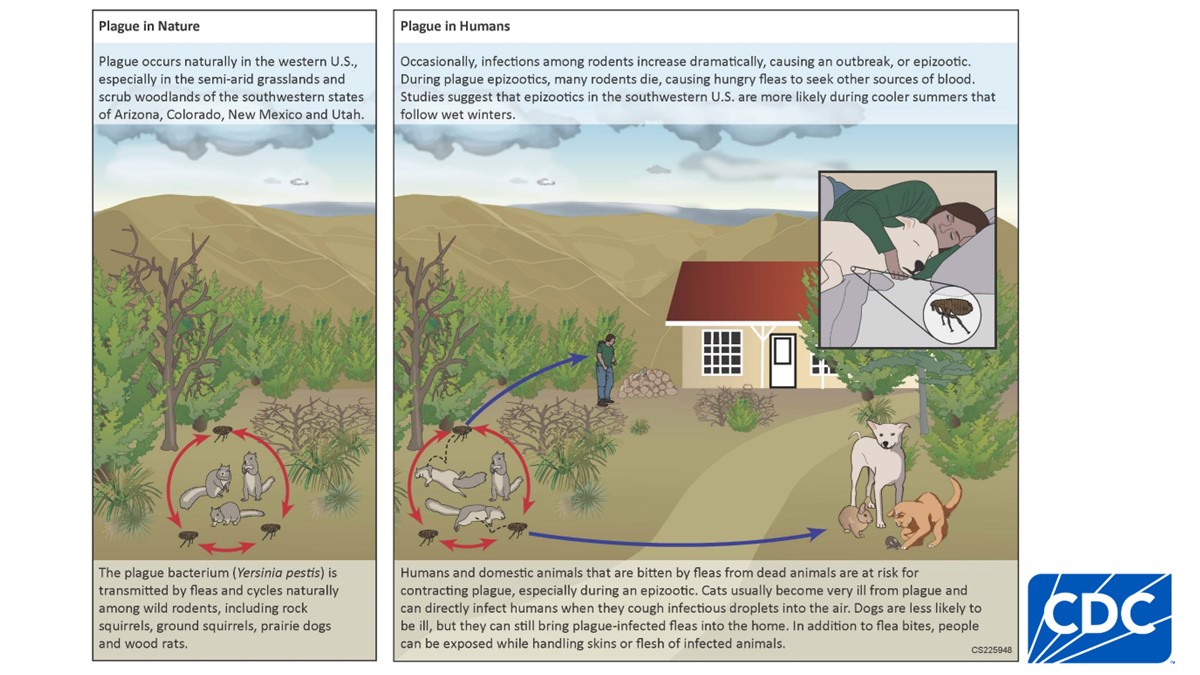
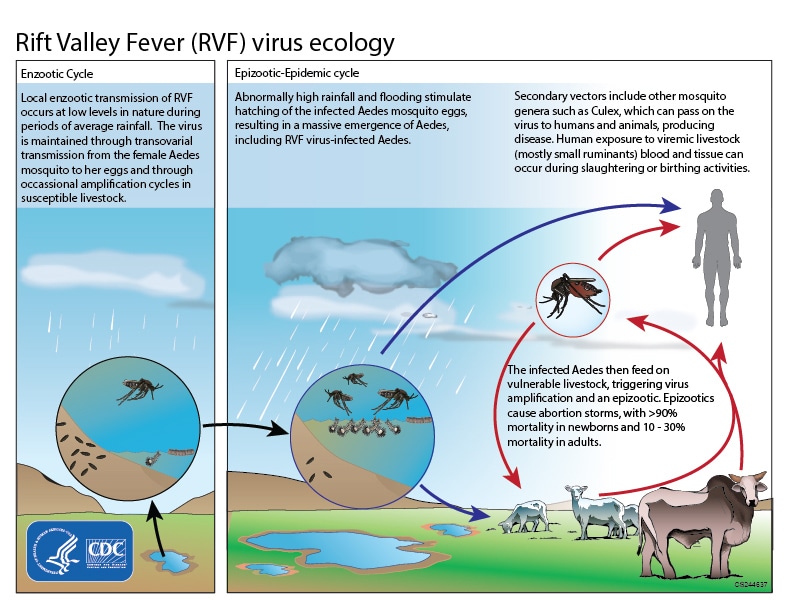
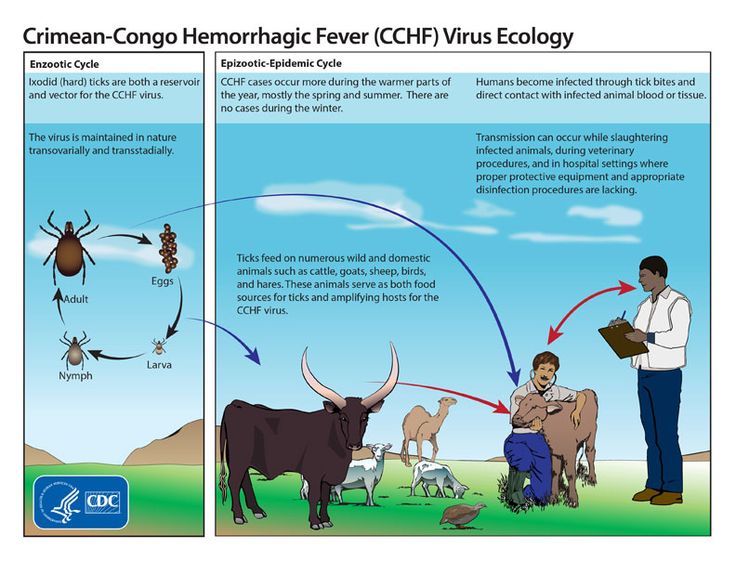
The most widely spread graphic of Ebola’s “cycles” was produced by the CDC for an information packet in response to the largest Ebola epidemic to date starting in 2014. This poster was released in English and French on August 4, 2014. At the time, some fundamental information on the transmission and epidemiology were still unknown. Lynteris focuses on the two boxes that separate the enzootic cycle and the epidemic cycle. This graphic is entirely set up to show that human infection is a rare accident, to make these environments look as separate as possible. The humans are pushed off to the corner down a dirt road and the infection stays within the family. These endemic/epidemic boxes become a common feature in the CDC’s graphical representations of many zoonotic diseases including plague in the US, Rift Valley Fever, or Crimean-Congo Hemorrhagic Fever.

This is a similar graphic from 2005 (below) when the cycle style was less popular. Obviously produced with clip art, it lacks the appeal of the 2014 version. These graphics have almost the same information but the older graphic is harder to read. In this graphic, the “natural host” is clearly still unknown. Ironically, this older graphic at least shows the possibility of it spreading beyond one family. On the other hand, it shows clearly white public health workers, observing but not intervening. This sends a message of ‘othering’, placing then entire Ebola problem in a primitive context that does not threaten outside observers. In reality, wildlife observation and confirming human-animal transmission was the primary purpose of the paper. The wildlife observers were doing necropsies (an autopsy on animals) and confirming transmission to humans. They noted that their warnings to public health authorieties were ineffective at preventing outbreaks of Ebola.

The most recent Ebola graphic (2016) produced by the CDC combines some aspects of both of these diagrams with a more “naturalistic” backdrop. Like the graphic from 2004, a hunter is identified as the conduit of infection. In both cases, the hunter is portrayed as being poor (2016) or primitive (2004). This is particularly odd given that the index case in the largest epidemic (in 2014) was an 18 month-old child.

Lynteris (p.15) notes that the 2016 diagram “anchors this diagram in geographies of blame, geographic and ethnographic imaginations of infectious disease…and even unmistakably racial aspects of epidemic attribution.” Note that the survivor is clearly of a higher economic status than the index case and is situated among a village backdrop. Traditional burial practices are blamed when any burial practice needs to be monitored for transmission opportunities. Burials practices in developed countries reflect our traditions and laws about burial. The ethnographic nature of this diagram becomes more stark when compared to a graphic the CDC produced on West Nile Virus (WNV) around the same time. This is the only “dead-end host” I have ever seen contracting the disease while planting flowers! The WNV diagram is strangely missing a reservoir host.

By making these diagrams free to the public, the CDC both encourages their message to be spread far and wide to all levels of viewers and has a lasting influence on graphic trends. Some part of the message will get through to everyone, even if they cannot read the text. Because they are freely available for reuse, they become trend setters in public health messaging.
The next two Ebola diagrams were produced by the European Centre for Disease Prevention and Control and released on 9 October 2014. The CDC Ebola Ecology graphic was published on August 4, 2014, so the ECDC could be intended to complement the CDC graphic.


In these diagrams, the emphasis has clearly shifted from personal to regional or even international transmission. This is more about keeping Europe safe than coping with the disease at its origin. The only two living organisms in these two diagrams are a couple of bats and a gorilla; humans are reduced to dots on the map. The text describes some practices blamed on transmission but humans are not present here either. “Traditional” burial (vs. “safe” burial) and local hospitals are shouldering the blame for transmission.
In their focus on controlling an outbreak, medical and public health professionals can be harsh in forcing changes to burial and medical practices. The anxiety this causes in the community can result in people hiding the sick or dead, exacerbating the outbreak. While changes may indeed need to be made to prevent transmission during an epidemic, a little more cultural sensitivity is in order. Efforts to change these practices and laws if necessary need to be a major public health effort in between epidemics and messaging matters.
Reference
Lynteris, C. (2017). Zoonotic diagrams: mastering and unsettling human‐animal relations. Journal of the Royal Anthropological Institute, 42, 713. http://doi.org/10.1111/1467-9655.12649
Rouquet P, Froment J, Bermejo M, Kilbourne A, Karesh WB, Reed P, et al. Wild Animal Mortality Monitoring and Human Ebola Outbreaks, Gabon and Republic of Congo, 2001–2003. Emerg Infect Dis. 2005;11(2):283-290. https://dx.doi.org/10.3201/eid1102.040533

